DashFLUboard is an open-source dashboard that offers near real-time tracking and analysis of avian influenza outbreaks. Developed as a collaboration between researchers in the US and Spain, this tool enables proactive surveillance and design of preventative measures in the poultry industry.
Avian influenza, also known as HPAI, H5N1, bird flu, and a myriad of other names, is an ongoing concern for both birds and humans.
Avian influenza entered the public consciousness in 2005, when signs of an imminent global pandemic were clear. In an effort to avoid the spread between birds and decrease the risk of the virus transmitting to humans, millions of birds were slaughtered. In the present day, this threat has reemerged and once again threatens bird populations worldwide. Using a combination of real-time disease data, historical wild bird movements, environmental variables, and locations of susceptible domestic populations DashFLUboard creates a comprehensive and accessible visualization. DashFLUboard is unique in that it enables both retrospective and prospective analyses of avian influenza dynamics, allowing users to assess the risk to their bird populations.
Using the Dashboard
This project was designed to be an accessible and user friendly interface for both those familiar and unfamiliar with GIS and other ESRI products. Those unfamiliar may find the ‘using the dashboard’ guide to be beneficial. The following is a brief overview of each pages’ usage.
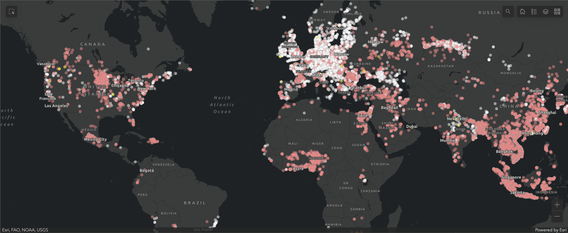
Historical Outbreak Records
The landing page for DashFLUboard, which allows users to easily explore and visualize the virus’s spread. This dashboard includes outbreak data from 2005 to the present with the available data being updated daily. Alongside this, there are various graphics that will allow you to view selected regions or total outbreaks.
Temps
This tab provides an interactive map displaying historical and real-time data of monthly mean temperatures, wind, and HPAI outbreaks. Temperature is an important factor as virus survival is inversely proportional to environmental temperature.
Wild bird Movements
This page allows users to explore HPAI outbreaks and wild bird connections between the United States and the entire globe. The time slider enables the exploration of the temporal aspect of outbreaks and bird movements.
News

Dashboard Helps Analyze and Predict Spread of Bird Flu
Revolutionizing the battle against avian influenza, a cutting-edge dashboard developed by Esri takes center stage, empowering researchers and health professionals with unprecedented tools to analyze and predict the spread of bird flu.